Normandy Shores | Estherpercal.com
About Normandy Shores
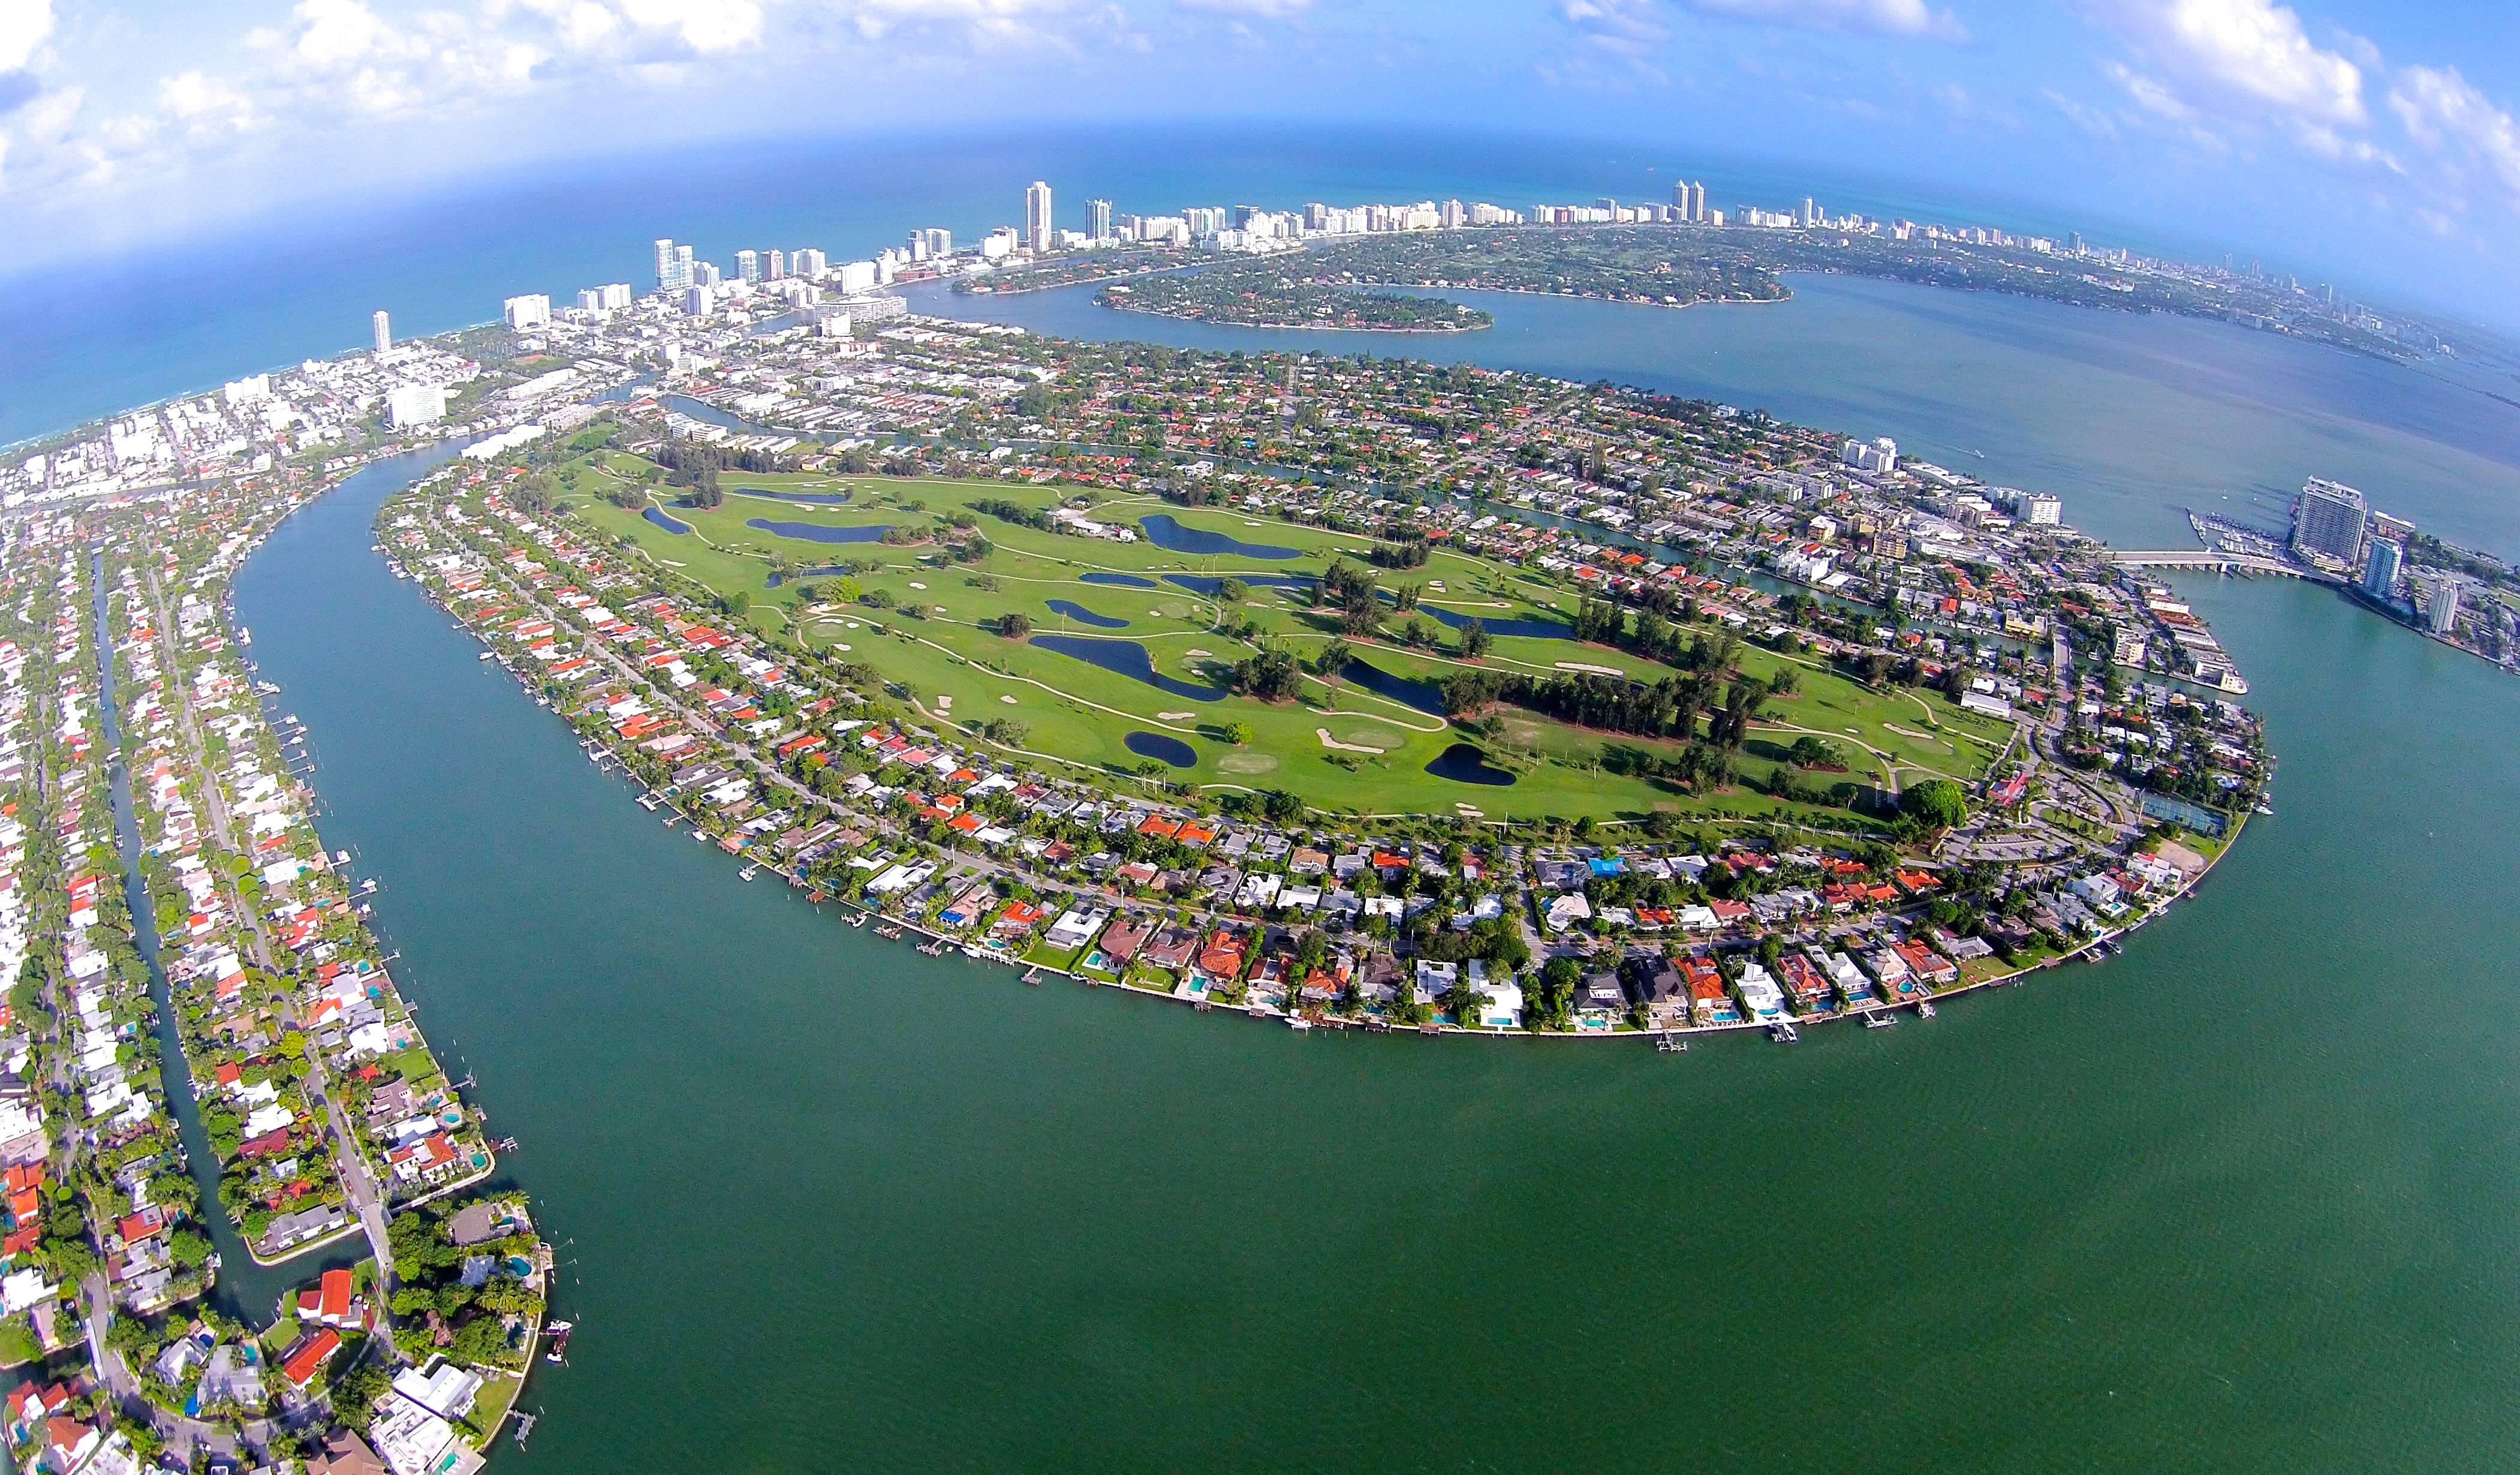
Normandy Shores is the Northern most part of Normandy Isle, a two-island residential community just west of 71 Street in Miami Beach that is connected by fixed bridges at Bay Road and Biarritz Road. In 1926, Henri Levi moved to Miami Beach from Ohio and took the once marshy land and dredged the land for 2 years straight to make Normandy Isle. Levi also helped construct the iconic 79th Street Causeway and Bridge. Normandy Shores is a guard-gated community, with public access at Biarritz Road and a residents-only entry and exit way off of North Shore Drive.
The community is an incredibly unique area to reside as it appeals to many walks of life. The Northern and Eastern part of the island is on the wide bay, making it ideal for boaters to access the ocean via Biscayne Bay. You have a mix of non-waterfront lots, waterfront homes on Biscayne Bay and on the Normandy waterway, the canal that separates Normandy Shores from Normandy Isles, and properties with a view of an 18-hole public golf course in the neighborhood. In addition to the golf course, there is a golf clubhouse with a restaurant, pro-shop, full clubhouse staff, tennis facilities, a basketball court, and a playground. It’s an excellent neighborhood for active families or people who want more of a͞ country club lifestyle without the pressure of a private club.
Waterfront Homes
Availables
As of September 7th 2018, there are 16 waterfront homes available for purchase. The price ranges are for $12,600,00 to $1,150,000. The average asking price per square foot is $924.
| Available Waterfront Homes | |||||||||
| Address | List Price | SF | Lot Size | Bed | Bath | Pool | YR Built | WF | $/SF |
| 1070 S Shore Dr | $12,600,000 | 8,083 | 19,950 | 7 | 7.5 | Yes | 2018 | 300 | $1,559 |
| 847 N Shore Dr | $6,590,000 | 5,500 | 12,425 | 6 | 6.5 | Yes | 2016 | 75 | $1,198 |
| 1125 N Shore Dr | $4,150,000 | 4,170 | 18,530 | 4 | 4 | No | 1950 | 105 | $995 |
| 710 S Shore Drive | $3,990,000 | 4,295 | 10,200 | 5 | 5.5 | Yes | 2014 | 70 | $929 |
| 887 N Shore Dr | $3,250,000 | 3,266 | 12,563 | 4 | 3 | Yes | 1951 | 74 | $995 |
| 675 N Shore Dr | $2,850,000 | 3,418 | 11,050 | 4 | 3.5 | Yes | 1953 | 60 | $834 |
| 605 N Shore Dr | $2,850,000 | 3,048 | 11,050 | 4 | 3 | Yes | 1953 | 70 | $935 |
| 595 N SHORE DR | $2,790,000 | 2,778 | 10,200 | 3 | 3 | Yes | 1951 | 60 | $1,004 |
| 225 N Shore Dr | $2,750,000 | 2,237 | 11,237 | 5 | 4.5 | Yes | 1955 | 66 | $1,229 |
| 970 S Shore | $2,749,000 | 3,016 | 11,050 | 4 | 4.5 | Yes | 1955 | 65 | $911 |
| 345 N SHORE DR | $2,450,000 | 3,094 | 15,300 | 4 | 3.5 | Yes | 1954 | 90 | $792 |
| 690 S Shore Dr | $2,250,000 | 1,954 | 10,200 | 3 | 3 | Yes | 1950 | 60 | $1,151 |
| 730 S Shore Dr | $1,790,000 | 3,013 | 11,475 | 4 | 3 | Yes | 1960 | 70 | $594 |
| 850 S Shore Dr | $1,599,000 | 2,178 | 10,200 | 3 | 2 | Yes | 1950 | 60 | $734 |
| 410 S Shore Dr | $1,295,000 | 3,198 | 11,050 | 4 | 3 | Yes | 1955 | 65 | $405 |
| 460 S Shore Dr | $1,150,000 | 2,240 | 11,050 | 3 | 3 | Yes | 1950 | 75 | $513 |
| Avg $/SF | $924 | ||||||||
Closed Sales
Waterfront homes on the Normandy Waterway range around the $1 million dollar range, and homes situated on Biscayne Bay range from at $2 million and up, with the higher priced homes boasting wide-bay views. 2614 Biarritz Drive has been the highest sale on the island to date, closing in March 2018 at $6 million. The sale really set a precedent for the island. The average price per square foot of waterfront homes sold from January 2017 to present is $756 per square foot.
| Closed Sales January 2017 to Present | |||||||||
| Address | Sale Price | Sq. Feet | Lot Size | Bed | Bath | Pool | YR | WF | $/S.F |
| 2614 Biarritz Dr | $6,000,000 | 6,511 | 12,008 | 6 | 6.5 | Yes | 2017 | 73 | $922 |
| 1001 N Shore Dr | $4,900,000 | 4,490 | 16,318 | 6 | 5.5 | Yes | 1952 | 96 | $1,091 |
| 1040 S Shore Drive | $2,800,000 | 5,647 | 10,200 | 6 | 5.5 | Yes | 1950 | 60 | $496 |
| 425 N SHORE DR | $2,886,000 | 4,553 | 11,050 | 4 | 3.5 | Yes | 1951 | 65 | $634 |
| 727 N Shore Dr | $2,050,000 | 2,250 | 12,425 | 3 | 3 | Yes | 1954 | 73 | $911 |
| 680 S Shore Dr | $1,250,000 | 2,576 | 10,200 | 3 | 3 | No | 1951 | 60 | $485 |
| Avg $/SF | $756 | ||||||||
Non-Waterfront Homes
Availables
| Available Non-Waterfront Homes | ||||||||
| Address | List Price | SF | Lot Size | Bed | Bath | Pool | YR Built | $/SF |
| 1001 Fairway Drive | $2,200,000 | 4,800 | 10,962 | 5 | 4 | Yes | 2014 | $458 |
| 935 S Shore Dr | $1,999,900 | 2,375 | 7,454 | 3 | 2 | No | 1955 | $842 |
| 865 Fairway Dr | $1,295,000 | 3,077 | 7,458 | 4 | 3 | Yes | 1951 | $421 |
| 985 S Shore Dr | $1,164,888 | 2,928 | 7,800 | 5 | 3.5 | Yes | 1949 | $398 |
| 1025 Fairway Dr | $1,089,000 | 2,094 | 8,065 | 4 | 3 | Yes | 1950 | $520 |
| 620 N Shore Dr | $900,000 | 1,932 | 7,800 | 3 | 2 | Yes | 1950 | $466 |
| 404 N Shore Dr | $799,000 | 1,693 | 7,200 | 3 | 2 | No | 1950 | $472 |
| 415 S Shore Dr | $777,000 | 2,060 | 7,200 | 3 | 2 | No | 1950 | $377 |
| 1001 S Shore Dr | $725,000 | 2,775 | 6,300 | 3 | 3 | Yes | 1956 | $261 |
| 740 N Shore Dr | $599,000 | 1,538 | 7,429 | 2 | 2.5 | No | 1951 | $389 |
| Avg $/SF | $460 | |||||||
Closed Sales
| Closed Sales January 2017 to Present | ||||||||
| Address | Sale Price | Sq. Feet | Lot Size | Bed | Bath | Pool | YR | $/S.F |
| 1001 Fairway Dr | $1,235,000 | 4,632 | 10,962 | 5 | 3.5 | Yes | 1956 | $267 |
| 605 Fairway Dr | $1,000,000 | 3,200 | 10,220 | 4 | 4 | Yes | 1951 | $313 |
| 910 N Shore Dr | $967,000 | 2,074 | 7,429 | 3 | 3 | Yes | 1951 | $466 |
| 425 Fairway Dr | $999,000 | 2,016 | 7,800 | 4 | 3 | Yes | 1949 | $496 |
| 565 Fairway Dr | $867,500 | 2,042 | 7,620 | 3 | 2.5 | Yes | 1951 | $425 |
| 535 South Shore Dr. | $875,000 | 2,430 | 7,585 | 3 | 2 | No | 1949 | $360 |
| 727 Fairway Dr | $815,000 | 2,639 | 7,458 | 5 | 3 | No | 1952 | $309 |
| 560 N SHORE DR | $850,000 | 3,002 | 7,200 | 4 | 3.5 | No | 1951 | $283 |
| 515 Fairway Dr | $715,000 | 2,178 | 7,200 | 3 | 2 | No | 1952 | $328 |
| 355 Fairway Dr | $710,000 | 1,886 | 7,200 | 3 | 2 | No | 1950 | $376 |
| 735 S SHORE DR | $700,000 | 2,053 | 8,046 | 3 | 2 | No | 1949 | $341 |
| 665 Fairway Dr | $664,500 | 2,201 | 7,200 | 4 | 3 | No | 1952 | $302 |
| 590 N SHORE DR | $630,000 | 2,298 | 7,200 | 3 | 2 | No | 1952 | $274 |
| 751 Fairway Dr | $643,500 | 2,379 | 7,458 | 3 | 2 | No | 1952 | $270 |
| 860 N Shore Dr | $630,000 | 2,098 | 7,429 | 3 | 2 | No | 1951 | $300 |
| 920 N Shore Dr | $580,000 | 1,745 | 7,429 | 2 | 2 | Yes | 1950 | $332 |
| 635 S Shore Dr | $550,000 | 1,869 | 7,200 | 3 | 3 | Yes | 1949 | $294 |
| 740 N Shore Dr | $560,000 | 1,538 | 7,429 | 2 | 2 | No | 1951 | $364 |
| Avg $/SF | $339 | |||||||