As we did for April of this year, we wanted to provide you an updated snapshot of the Miami Beach residential real estate market, now that most markets and industries have begun to re-open. Everyone has their opinion and predictions for where the market is and where it’s going, but we want to share and analyze the facts and numbers with you.
Below are graphs comparing the time period from May 1st-29th of this year and June 1st-29th, followed by graphs comparing the June 2019 numbers with the June 2020 numbers.
The numbers show that sales and activity are significantly up from last month to this month.
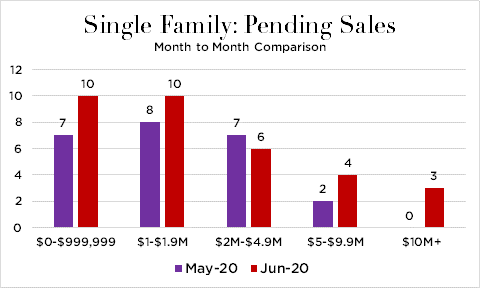
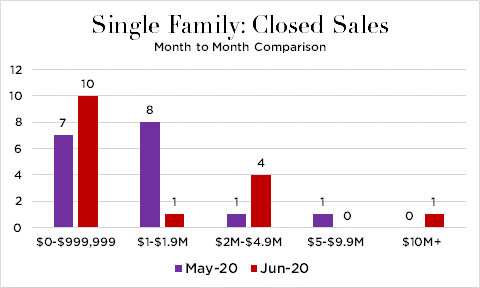
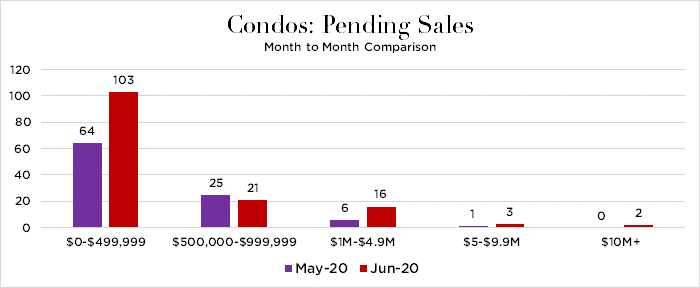
Pending sales are up 45.5% for single family homes and 51% for condos. Closed sales are up 37.5% for single family homes and 36.8% for condos
Compared to last year, the largest increase is in Pending Sales for single family homes, which are up 65% from this same time last year.
Closed sales for June 2020 compared to last year are down (11.1% for single family and 52.7% for condos).
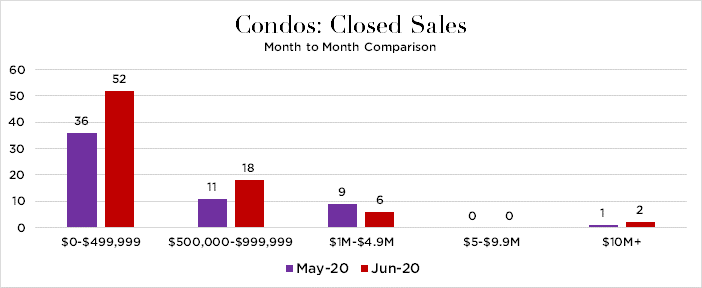
Month to Month Comparison: May vs June 2020
| Active | Pending | Sold | |
| $0-$999,999 | 65/58 | 7/10 | 7/10 |
| $1-$1.9M | 111/1105 | 8/10 | 8/1 |
| $2M-$4.9M | 120/129 | 7/6 | 1/4 |
| $5-$9.9M | 57/51 | 2/4 | 1/0 |
| $10M+ | 65/67 | 0/3 | 0/1 |
| Total | 418/410 | 11/16 (45.5% +) | 24/33 (37.5% +) |
Condos – Miami Beach
| Active | Pending | Sold | |
| $0-$499,999 | 1,585/1,605 | 64/103 | 36/52 |
| $500,000-$999,999 | 622/624 | 25/21 | 11/18 |
| $1M-$4.9M | 512/531 | 6/16 | 9/6 |
| $5-$9.9M | 92/96 | 1/3 | 0/0 |
| $10M+ | 44/46 | 0/2 | 1/2 |
| Total | 2,855/2,902 | 96/145 (51%+) | 57/78 (36.8%+) |
Year to Year Comparison: June 1-21, 2019 VS June 1-21, 2020
Single Family Homes – Miami Beach
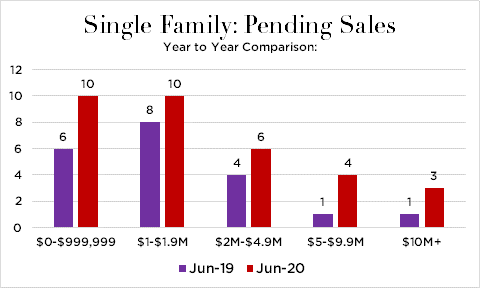
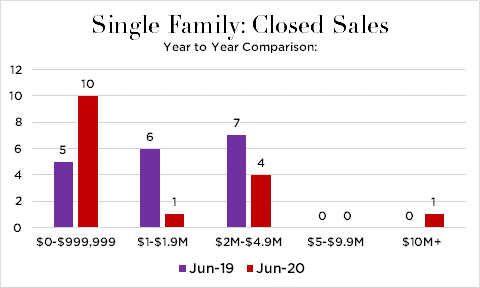
| Active | Pending | Sold | |
| $0-$999,999 | 60/58 | 6/10 | 5/10 |
| $1-$1.9M | 134/105 | 8/10 | 6/1 |
| $2M-$4.9M | 117/129 | 4/6 | 7/4 |
| $5-$9.9M | 72/51 | 1/4 | 0/0 |
| $10M+ | 70/67 | 1/3 | 0/1 |
| Total | 453/410 | 20/33 (65%+) | 18/16 (11.1%-) |
Condos – Miami Beach
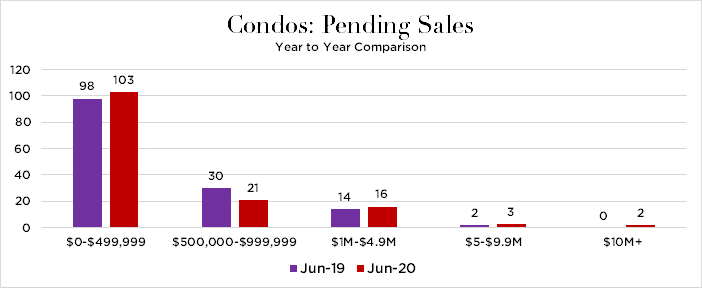
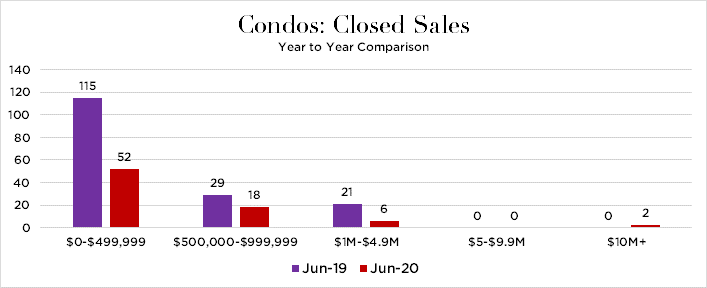
| Active | Pending | Sold | |
| $0-$499,999 | 1,589/1,605 | 98/103 | 115/52 |
| $499,999-$999,999 | 659/624 | 30/21 | 29/18 |
| $1M-$4.9M | 566/531 | 14/16 | 21/6 |
| $5-$9.9M | 75/96 | 2/3 | 0/0 |
| $10M+ | 30/46 | 0/2 | 0/2 |
| Total | 2,919/2,902 | 144/145 (0.7%+) | 165/78 (52.7%-) |